“Previewing a product in 3D, from every angle, reduces returns.” You have read this sentence, or one very close to it, on more configurator and visualisation vendor pages than you can count. We have written versions of it ourselves. Ask any of us for the study behind it and watch what happens.
Usually, nothing happens. There is no study. There is a case study, which is a different thing wearing the same clothes: one client, one launch, a “returns dropped” line with no baseline period stated, no control group, and no way to know whether the fabric supplier changed at the same time, or the price did, or the checkout flow did. A case study tells you something happened after something else. It does not tell you why.
Why this is genuinely hard to measure
To prove that 3D preview reduces returns, you would need two otherwise identical stores, same products, same traffic, same season, one showing static photos and one showing full 3D preview, running long enough to collect a meaningful sample of returns, with every other variable held still. Nobody runs that test. Not because the answer would be inconvenient, but because the retailer paying for the site does not want half their customers seeing the worse version on purpose, and no vendor has an incentive to fund a trial that might come back flat.
So the number on the slide is almost always one of three things: an average lifted from an unrelated product category, a customer’s own unverified estimate repeated as a fact, or a genuine before-and-after at one client with no control for anything else that changed in the same window. None of those is a lie exactly. None of them is a measurement either.
We wrote almost the same sentence about a narrower claim, dimension drawings specifically, in our piece on catalogue-wide dimensions: we do not publish a return-rate figure for that either, because we have not measured one we would stand behind. The honest version of this post says the same thing about the bigger claim.
The cost that is actually easy to see
Here is what does not require a controlled study, because you can watch it happen in your own analytics this week: a buyer who cannot tell what they are about to receive does not usually go ahead and order the wrong thing. They stop.
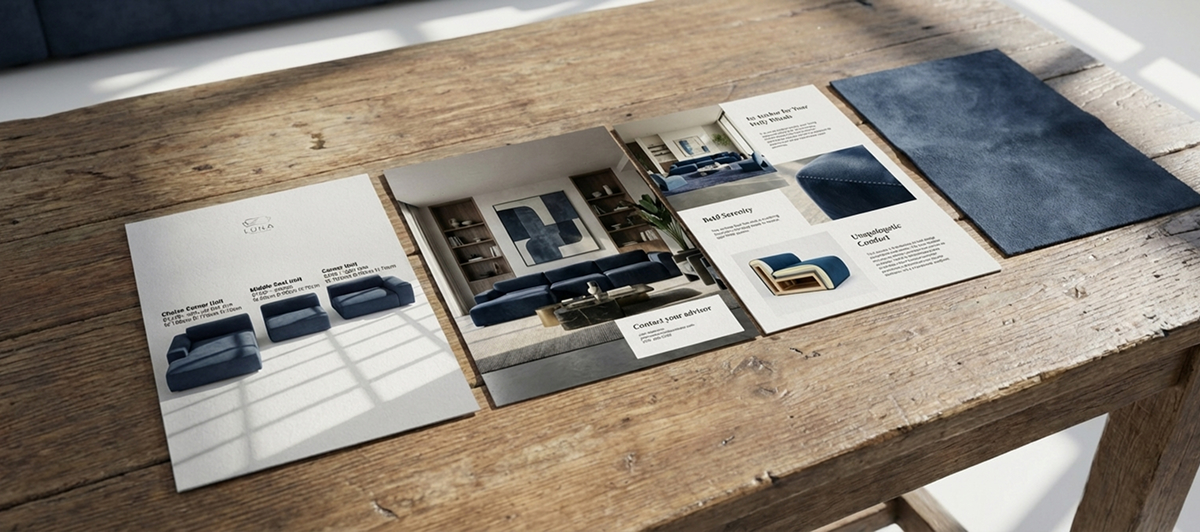
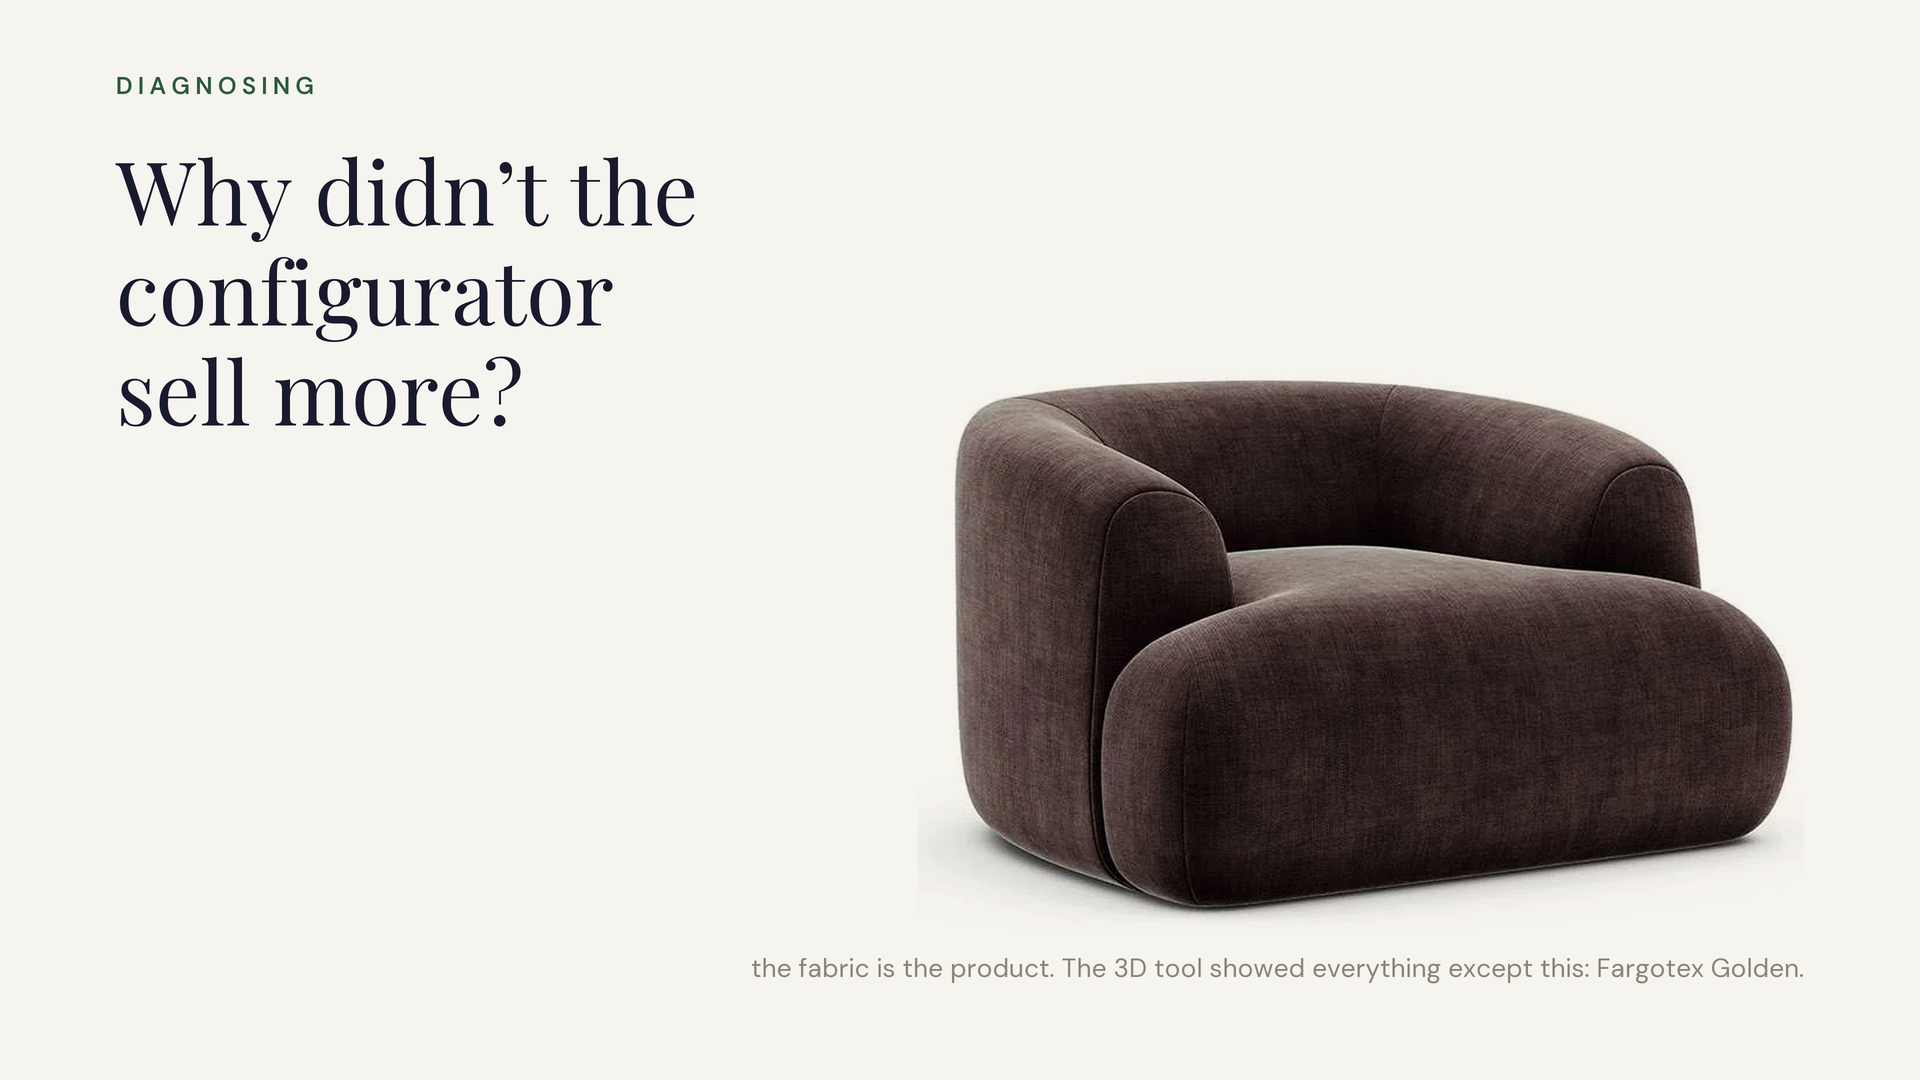
We saw this directly building the fabric visuals for Mitto Home, a Polish upholstered furniture brand sold almost entirely from a screen. Nobody orders a sofa from a bad photo. The render’s whole job is to hold the buyer’s attention long enough that they order a physical fabric swatch and hold it against their own room, which is the step that actually resolves “will this look right here”, not the return policy. If the render is not convincing, the swatch never gets ordered, and the sale is gone before a return could ever have happened. That drop-off is invisible to a returns report. It shows up nowhere except a lower add-to-basket rate on that one page, which is exactly the metric most stores are not segmenting by image quality.
The same logic runs the other way on Paradise Grills’ showroom floor: a rep who can show a customer the exact configuration, priced, on screen, closes in minutes instead of the half hour it used to take on paper. Nobody there is measuring returns either. What changed is the number of conversations that reach a signature at all.
Returns get budget and attention because they are a line on a P&L. Pre-purchase abandonment does not get a line, so it survives every review, year after year, while the industry keeps selling a fix for the number everyone can see and ignoring the one that is actually bigger.
Where 3D preview probably does touch returns, and where it can make them worse
We are not arguing that visual fidelity has zero relationship to what happens after checkout. There is one place the mechanism is genuinely plausible: a return whose stated reason is “did not look like the picture.” A colour that renders warmer than it ships, a scale nobody could judge from a flat photo, a texture that reads smooth on screen and arrives coarse. An accurate preview should reduce exactly that category of return, because it closes the specific gap that caused it.
But notice the condition doing all the work: accurate. A 3D preview built from an idealised studio light, a slightly-off material, or a scale nobody bothered to calibrate does not close that gap, it moves it. It sets an expectation the physical product then fails to meet, which is a plausible way for a bad 3D preview to increase returns in that same category, not reduce them. Nobody puts that version on a slide.
The question to ask instead of the return-rate number
The next time a vendor tells you their preview reduces returns, do not ask for the percentage. Ask these three things instead:
- Reduces returns compared to what, over what period, with what else held constant? If the answer is a single client’s before-and-after with no control, you have a case study, not evidence.
- Is the material and colour in the preview measured against a physical reference, or eyeballed from a photo? An unmeasured preview cannot close the gap it claims to close, and may open a new one.
- What happens earlier, before checkout, when the preview is bad? If they cannot answer this, they have not looked at the number that is actually costing you money.
What we can show you
We do not have a return-rate figure for our own work, and we are not going to invent one to finish this post cleanly. What we can show you is the earlier number: a render that fails to hold attention loses the sale before a return is even possible, and we can point to it in analytics you already have. If you want to see what a fabric preview looks like when it is measured against the physical swatch rather than eyeballed, that is the whole story in Fabric Digitization and in the Mitto Home case study.
FAQ
Does 3D preview reduce returns? Nobody has published a controlled study that isolates 3D preview from everything else that changes when a brand adopts it, so treat any specific percentage with suspicion and ask for the method behind it. The plausible mechanism is narrow: an accurate preview can reduce the specific returns caused by a mismatch between what was shown and what arrived. An inaccurate one can make that same category worse.
What should we measure instead? Pre-purchase abandonment on the product page, especially any drop after a buyer views a render or configuration but before they add a variant to basket or order a physical sample. That cost is real, present in analytics most stores already have, and invisible in a returns report.
Is this an argument against 3D preview and configurators? No. It is an argument against a specific unsourced claim used to sell them. The case for accurate visuals is the one we can actually stand behind: they keep a buyer deciding instead of guessing, and guessing is what ends a sale before it starts.